
UTQG Tire Ratings Explained: Treadwear, Traction & Temperature
UTQG stands for Uniform Tire Quality Grading. It is a standard label that helps you compare tire treadwear, wet traction, and heat resistance. The treadwear rating is a number, usually between 100 and 1000. It estimates how long the tire will last based on a controlled road test. Traction gets a letter grade of AA, A, B, or C for wet stopping power. Temperature ratings are A, B, or C based on how well the tire handles heat at high speeds. Manufacturers test their own tires under NHTSA rules. These ratings give you a helpful baseline, but keep in mind that real-world results will vary.
Quick Answer
- Treadwear (100 to 1000): Higher numbers mean the tire should last longer compared to a standard test tire.
- Traction (AA, A, B, C): Grade AA offers the best stopping power on wet roads.
- Temperature (A, B, C): Grade A handles heat the best at sustained high speeds.
- The Bottom Line: UTQG is a helpful starting point. However, your driving habits, local climate, and road conditions will ultimately determine your tire’s true performance.
Where to Find UTQG Ratings on Your Tire
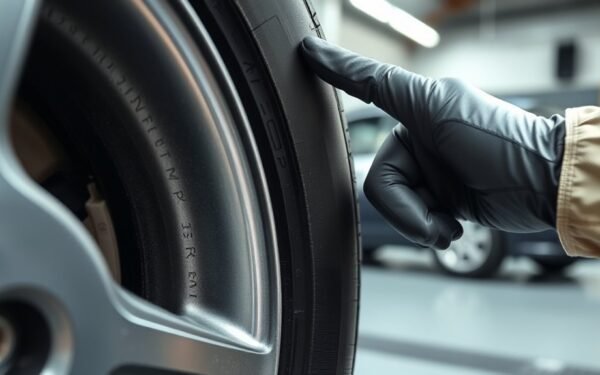
You can find the UTQG ratings printed directly on the sidewall of your tire. Look for the word “TREADWEAR” followed by a number. Next to it, you will see “TRACTION” with a letter grade, and “TEMPERATURE” with a letter grade. These ratings are usually located near the tire size and brand information.
What UTQG Measures and Why It Matters
The UTQG rating measures three parts of tire performance. These are treadwear, traction, and temperature resistance. This system lets you compare tires using the same criteria. Treadwear grades estimate lifespan compared to a control tire. Higher numbers mean the tire wears down slower and lasts longer. Traction grades describe wet-stopping ability. AA means the best grip. Temperature grades show heat resistance. An A rating means the tire handles speeds over 115 mph safely. Together, these numbers create a standard way to compare tires. They also help you evaluate overall tire safety. When buying tires, think about your expected mileage, wet traction needs, and typical driving speeds.
[Products Worth Considering]

Optimized for CUV/SUV dynamics: Engineered specifically for modern CUV/SUV applications, this tire delivers precise steering response and exceptional handling stability while maintaining cabin-quiet comfort.

S FIT AS tires mold an ultra high performance all-season compound into an asymmetric tread design.

All-Season Precision & Quiet Comfort: Engineered for modern CUVs and SUVs, the asymmetrical tread design delivers precise steering response and handling. Optimized pitch sequencing reduces road noise for a smooth and comfortable ride.
Quick Take: Should UTQG Change Your Tire Choice?
How much should UTQG ratings influence your choice? Use them as a basic filter. Prioritize treadwear if you want the tire to last. Focus on traction and temperature for safety. Match the ratings to your driving style. Commuting calls for higher treadwear. High-speed driving or wet climates require better traction and A or B temperature grades.
| Use case | Key UTQG focus | Decision tip |
|---|---|---|
| Daily commute | Treadwear | Choose higher numbers for longevity |
| Wet climates | Traction | Select AA or A for stopping power |
| High-speed driving | Temperature | Pick A grade to prevent heat failure |
UTQG is not the only factor. Combine these grades with tire construction, reviews, and manufacturer data to make a smart and safe purchase.
[Products Worth Considering]

All Season traction: Biting tread block edges designed to provide all-season traction in wet, dry and snowy conditions

A Tire You Can Count On

Size: 255/70R16, an all terrain tire specifically engineered for SUVs, Tire Only - Wheel/Rim Not Included.
How UTQG Ratings Are Assigned (Manufacturers vs NHTSA)
Manufacturers run the UTQG tests themselves. They test treadwear, traction, and temperature under NHTSA standards. The government agency does not run the first tests. Instead, it does random checks to ensure compliance and fairness. This setup changes how you should view the grades and their reliability.
Manufacturer Self-Testing
Manufacturers give UTQG ratings using their own testing methods. They follow NHTSA rules, but the agency only does random checks later. Companies run the 7,200-mile treadwear test on a road course. They also do lab tests for traction and temperature. This self-testing model can create bias. The companies control the process and read the results. You should look for testing transparency. This includes clear procedures and data that match NHTSA rules. Without full disclosure, remember that the manufacturer controls these numbers.
NHTSA Oversight Checks
It is important to understand the role of the NHTSA in this process. You rely on their random compliance checks to keep the grading fair. The NHTSA audits the manufacturer data. They do random tests to protect the integrity of the grades. The treadwear grade comes from a 7,200-mile road test. Traction and temperature use lab tests. Manufacturers do the work, but the NHTSA sets the rules.
- Manufacturer discretion can cause inconsistency.
- Grades should reflect real-world performance.
- Random audits help catch testing errors.
- Transparent testing builds consumer trust.
- Consistent grading is essential for fair comparisons.
How Treadwear Grades Are Determined
The process starts with a standardized 7,200-mile treadwear test. This measures wear under controlled conditions. The tire’s wear is then compared to a Course Monitoring Tire rated at 100. This produces the treadwear grade. For example, a tire might get a 400 rating while the control gets a 200. Remember that your driving habits, local climate, and road conditions will change real-world results. The grade is a comparative tool shown on the sidewall, not an exact lifespan promise.
Treadwear Test Procedure
Tire makers find treadwear grades by running new tires alongside a control tire rated at 100. They use a calibrated 7,200-mile course that mimics real-world driving. Technicians measure the wear rates. They write the final grade as a ratio of the test tire’s remaining tread compared to the control tire. A 200 grade means it lasted roughly twice as long as the control under test conditions. You should not treat the grade as a mileage warranty. Tire life varies greatly based on how and where you drive. The NHTSA performs random checks to verify these claims.
- Buyers expect accurate data from tests.
- The testing process must be repeatable.
- Grades need context to be useful.
- Real-world variability is a major factor.
- Mileage warranties offer different protection than treadwear grades.
Control Tire Comparison
A standardized control tire gets a treadwear index of 100. Testers drive it over a calibrated 7,200-mile course. This serves as the baseline for all other tires. The control tire is tested under strict speed, load, and road conditions. New tires run the exact same protocol. Their total mileage is divided by the control tire’s mileage to find the final treadwear grade. A grade of 200 means roughly double the service life of the control tire. Manufacturers report these grades based on their tests. The method gives you a comparative scale, not a crystal ball for your exact mileage.
Real-World Variability
Standard tests compare tires on a perfect 7,200-mile course. However, real-world treadwear often looks different. Your driving habits, local roads, and climate change how fast tires wear out. Treat UTQG treadwear grades as a general guide. A 200 grade means it did twice as well as the control tire in a test. It does not guarantee a specific lifespan on your car. The test uses a controlled course to keep measurements fair, but marketing can confuse the facts. To estimate true service life, look at objective wear factors and your daily driving routine. Accept that there is some uncertainty, and check your tread regularly.
- Mileage often falls short of the label’s promise.
- Mixed climates make wear patterns unpredictable.
- Documented data gives buyers more confidence.
- Marketing claims often exaggerate test results.
- Conservative estimates are safer for planning tire replacements.
Traction Grades (AA–C): Tests and What They Mean

Traction grades show how fast a tire can stop on wet pavement. The grades are AA, A, B, and C. Testers measure stopping distance on wet asphalt and wet concrete at 40 mph. You can use these grades to check tire safety and wet performance. The standard rules ensure consistent metrics across all brands. AA-rated tires stop the fastest. C-rated tires take the longest. Keep in mind that traction grades only measure straight-line stops. They do not measure cornering or dry grip. In bad weather, higher traction grades help reduce your stopping distance.
Temperature Grades (A–C) and High-Speed Performance
A tire’s temperature grade shows how well it handles heat at high speeds. The grades are A, B, and C. An A-rated tire cools down effectively. This lowers the risk of failure at speeds above 115 mph. Grade C is the lowest allowed grade in the U.S. It handles speeds between 85 and 100 mph.
Heat Dissipation Capability
Heat buildup is the main reason tires fail at high speeds. The UTQG temperature grade tells you how well a tire sheds heat. Grade A offers the highest resistance for speeds over 115 mph. Grade B is the middle ground. Grade C works fine for speeds around 85 to 100 mph. You can use this grade to predict tire safety on long, fast drives. Lab tests use high-speed drums to see how well an inflated tire resists heat damage. A lower grade means a higher risk of overheating and performance loss.
- Tires must cool down reliably under stress.
- Sudden heat failures are a major safety risk.
- Predictable handling at high speeds is critical.
- Heat resistance helps tires last longer.
- Measurable safety margins give drivers peace of mind.
Speed Rating Correlation
If you plan on driving at high speeds, you need to match the tire’s temperature grade to your car. Correlate the temperature grade with the expected speed rating. This ensures the tire can handle the heat on the highway. Grade A has the highest heat tolerance for speeds over 115 mph. Grades B and C cover lower ranges. Higher temperature grades shed heat better and reduce blowout risks. These ratings come from controlled lab tests. Use them to pick tires that match your typical driving speeds.
Limits of UTQG: Real-World Variability and Testing Gaps
UTQG provides standard labels, but the tests are limited in scope. You should treat UTQG as a baseline. It is not a perfect predictor of real-world performance. Testing consistency varies between companies. Treadwear ratios do not predict exact mileage for your specific driving style. Traction and temperature grades measure very narrow traits. They ignore cornering, hydroplaning, and long-term high-speed behavior. Relying entirely on manufacturer testing creates gaps in independent verification.
UTQG is a baseline, not a guarantee. Manufacturer ratings miss real-world factors like cornering, hydroplaning, and sustained high-speed performance.
- Treadwear numbers rarely match actual driving miles exactly.
- Wet-stop claims do not account for deep water or heavy rain.
- Self-reported grades can lead to a lack of trust.
- Inconsistent testing makes direct comparisons difficult.
- Basic tests do not capture unseen high-speed limits.
When UTQG Doesn’t Apply (Light Trucks, Winter, Specialty Tires)
UTQG has gaps, and it does not cover every tire type. Light truck tires are exempt because they use different load criteria. Dedicated winter tires are also exempt. UTQG does not test performance in snow or cold weather. Specialty tires for racing or off-roading lack UTQG ratings as well. These tires use unique compounds for specific tasks. For these tires, you must use alternative metrics. Look at manufacturer specs, lab data, and real-world reviews. Compare braking, snow traction, and load ratings instead of expecting a universal UTQG score.
| Tire Type | Reason Exempt | Alternative Metrics |
|---|---|---|
| Light truck tires | Different criteria | Load index, ply rating |
| Winter tires | Cold-weather design | Snow traction tests |
| Specialty tires | Unique use-case | Track/lab performance |
Common Mistakes and Marketing Traps to Avoid
UTQG numbers come from controlled tracks. You cannot assume a higher treadwear number guarantees a longer life on your specific commute. Be careful with marketing claims that oversimplify the data. Treat traction, treadwear, and temperature as helpful context. They are not absolute guarantees. Watch out for claims that ignore driving style, road surfaces, and the local climate.
Remember: UTQG numbers are lab data, not guarantees. Consider your driving style, local roads, and climate before trusting the ratings completely.
- A “500” treadwear tire might wear fast if driven aggressively.
- An “AA” traction grade does not mean perfect all-weather mastery.
- Speed-grade limits need careful attention before long trips.
- Test conditions are often left out of marketing brochures.
- Comparative claims are sometimes inflated by tire brands.
Always question tire marketing that lacks transparent test methods and real-world context.
How to Compare Tires: Combining UTQG With Reviews and Specs
You should pair UTQG numbers with real-world reviews and full specifications. Use treadwear ratings to estimate lifespan. A 200 rating implies twice the life of a 100-rated control tire. Use traction grades to gauge wet stopping performance. Check temperature grades for heat resistance if you drive fast often. Cross-reference these numbers with objective specs like tire construction and the speed index. Finally, look at consumer feedback. Reviews will tell you about everyday handling, road noise, and irregular wear patterns that lab tests miss. Pick a combination that fits your driving profile.
[Products Worth Considering]

Designed for use on performance-oriented vehicles in warmer weather conditions

Frequently Asked Questions
What Is a Good UTQG Treadwear Rating?
A good treadwear rating is typically 400 or higher. A 600 rating lasts about 50 to 60 percent longer than a 400. An 800 rating roughly doubles the expected lifespan of a 400.
What Is a 200 Rating on UTQG?
A 200 rating means the tread wears twice as slowly as the 100 control tire. It is a clear comparison benchmark, though your real-life driving habits will still affect longevity.
What Is the Treadwear 500 Traction A Temperature?
A treadwear of 500 means you can expect about five times the tread life of the control tire. Traction A means it meets high standards for wet braking. Temperature A means it resists heat very well at high speeds.
Are UTQG Ratings Reliable?
They are somewhat reliable as a basic comparison tool. However, you should expect some variability and manufacturer bias. Always combine UTQG grades with independent tests and real-world reviews.
Conclusion
The UTQG system gives you numbers for treadwear, traction, and temperature. They sound scientific and offer a great starting point. Just do not treat the grades as gospel. Use UTQG to screen your options. Then, validate those choices with real-world reviews, load ratings, and your specific vehicle needs. Remember that winter and light truck tires are exempt. Treat UTQG like a single tool in your toolbox. It is handy and precise when used correctly, but it cannot fix everything on its own.
Related Articles
What Does THE P Stand For on a Tire? Full Meaning Explained
I’ll explain what the “P” on a tire really means and why it could change how you choose your next set.
Read More
How to Use a Tubeless Tire Repair Kit: Complete Field Guide
Learn how to fix tubeless tire punctures fast with the right kit, because one small mistake can leave you stranded on the trail.
Read More
How to Tell a Tire’s Diameter: Easy Guide to Reading Tire Size
Want to decode tire sidewall numbers and find the right diameter, but wonder what those hidden digits really mean?
Read More